
September,2024
The Evolution of Data Visualization: New Tools That Are Changing the Game
Category: Data Visualization

Effective data visualization has become more than just a tool—it’s a language. With the surge in data across industries, organizations are relying on modern data visualization solutions to translate complex datasets into actionable insights. As businesses aim to become more data-centric, visual tools that simplify the interpretation process are crucial.
According to recent statistics, the global data visualization market is expected to grow from $8.85 billion in 2022 to $19.20 billion by 2028. This surge highlights the increasing importance of sophisticated data visualization services for businesses looking to harness the power of their data. But how did we get here? And what new tools are revolutionizing the way we visualize data?
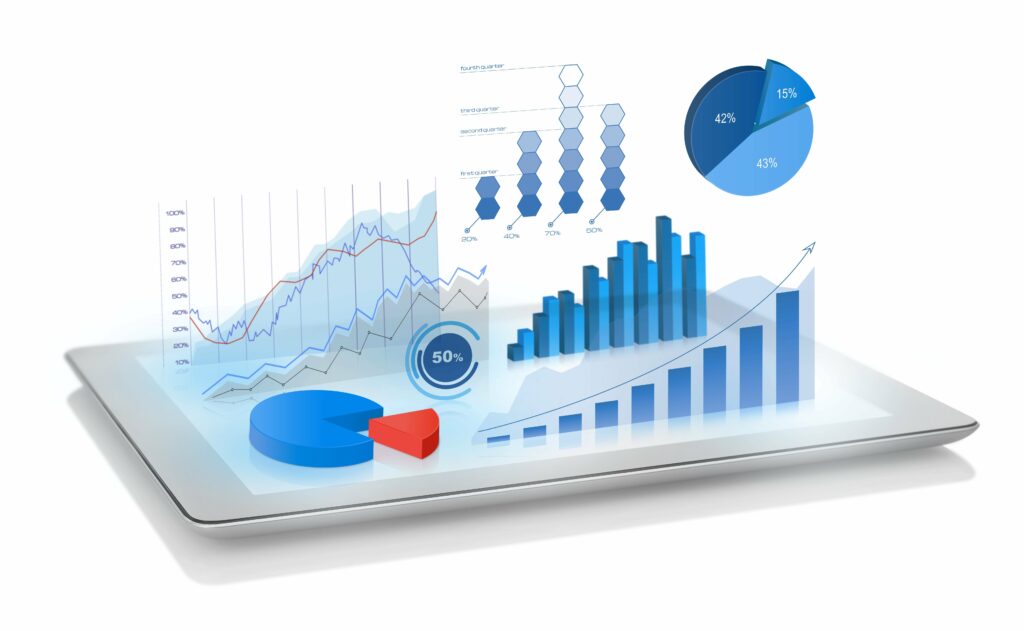
The Evolution of Data Visualization
Data visualization has come a long way since the days of basic charts and graphs. In the early stages, tools like pie charts and bar graphs were the primary methods used to convey data. However, as datasets have grown exponentially, so has the demand for more interactive and insightful visualization methods.
The evolution of data visualization can be attributed to technological advancements. From static visuals to real-time dynamic dashboards, the shift has been transformative. Today, modern data visualization solutions provide capabilities that allow users to interact with data in ways never before possible. This progression has given rise to tools that offer deep insights through interactive dashboards, 3D charts, and even AI-powered visual analytics. As businesses continue to demand more from their data, visualization tools are adapting to meet these needs.
Good Data Visualization Examples
Good data visualization goes beyond making information look aesthetically pleasing—it ensures data is accessible, easy to understand, and actionable. Some of the most powerful examples of data visualization come from real-world applications.
For instance, during the COVID-19 pandemic, the Johns Hopkins University dashboard quickly became a vital tool for tracking the virus’s spread globally. The dashboard’s use of interactive maps and real-time data updates made it an invaluable resource for governments and the public alike. This example highlights the power of data visualization in making complex datasets understandable in real-time scenarios.
Another example is Google Analytics, which uses data visualization to help businesses track website performance. By presenting key metrics through visual dashboards, companies can easily identify trends, monitor user behavior, and make informed decisions.
Data Visualization Real-Life Examples
In the corporate world, the use of advanced data visualization tools is transforming industries. For example, in healthcare, data visualization helps analyze patient records, identify trends in disease outbreaks, and optimize treatment plans based on real-time data. In finance, it’s used to monitor stock market trends and forecast future investments, allowing traders to make more informed decisions.

One notable real-life example is the work of NASA. The space agency use s data visualization to track and monitor space missions, analyze satellite data, and model future scenarios. The ability to visualize such complex data sets allows NASA to make informed decisions that could impact space exploration.

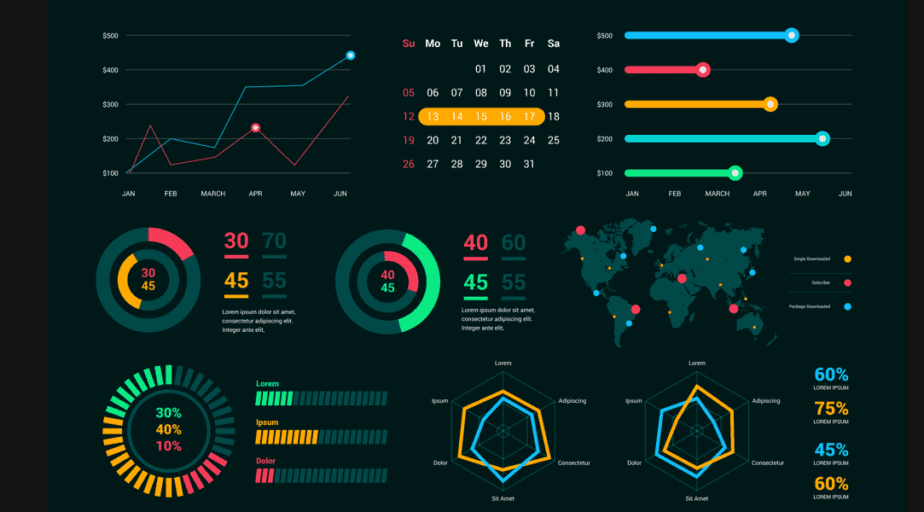
New Data Visualization Tools That Are Changing the Game
With advancements in technology, data visualization tools are more powerful, accessible, and intuitive than ever before. The following tools are at the forefront of this evolution, offering businesses cutting-edge ways to visualize their data:
- Tableau: Widely regarded as a leader in data visualization services, Tableau allows users to create dynamic, interactive dashboards. Its drag-and-drop functionality makes it accessible for non-technical users, while its robust features offer deep insights into large datasets.
- Power BI: Microsoft’s Power BI is another key player in the data visualization landscape. With seamless integration into the Microsoft ecosystem, Power BI allows businesses to connect data from multiple sources, transforming it into immersive visual insights.
- D3.js: For developers looking for customization, D3.js offers a powerful JavaScript library for creating web-based visualizations. This open-source tool allows users to build complex and highly interactive visualizations that can be tailored to specific business needs.
- Google Data Studio: Google’s free data visualization tool is becoming increasingly popular, especially for smaller businesses. It integrates seamlessly with other Google services, such as Google Analytics, allowing users to create customized reports and visualizations.
- Qlik Sense: Another advanced tool that leverages AI and machine learning, Qlik Sense offers powerful data visualization solutions. Its unique associative analytics engine allows users to explore data without limitations, uncovering hidden insights and connections.
The Future of Data Visualization: What’s Next?
Looking ahead, the future of data visualization lies in the integration of artificial intelligence and machine learning. AI-powered data visualization tools are already allowing businesses to analyze data faster and more accurately. As AI continues to evolve, it will enable even deeper levels of data analysis, helping companies uncover insights that were previously hidden.
Additionally, the rise of augmented reality (AR) and virtual reality (VR) is set to revolutionize data visualization. Imagine stepping into a virtual environment where you can interact with 3D visualizations in real time. This level of immersion could transform industries like healthcare, finance, and education by offering a new way to explore and interpret data.
Conclusion
The world of data visualization is evolving at an unprecedented pace, with new tools and technologies constantly pushing the boundaries. Whether it’s through interactive dashboards, AI-powered insights, or immersive AR/VR experiences, the future of data visualization is bright. For businesses looking to stay competitive in a data-driven world, leveraging cutting-edge data visualization services and tools is no longer optional—it’s essential.
At AffinityCore, we specialize in providing Data Visualization Solutions that empower organizations to transform their data into actionable insights. From Data Visualization Services to innovative tools, we help businesses make sense of their data and drive growth.
Contact us today to learn more about how we can support your data visualization needs.